
R でグラフを複数並べる方法の解説

目次
R でグラフを複数並べる方法 layout()
グラフを並べて描きたいと思うことは多い
R の場合、layout() という関数を使う
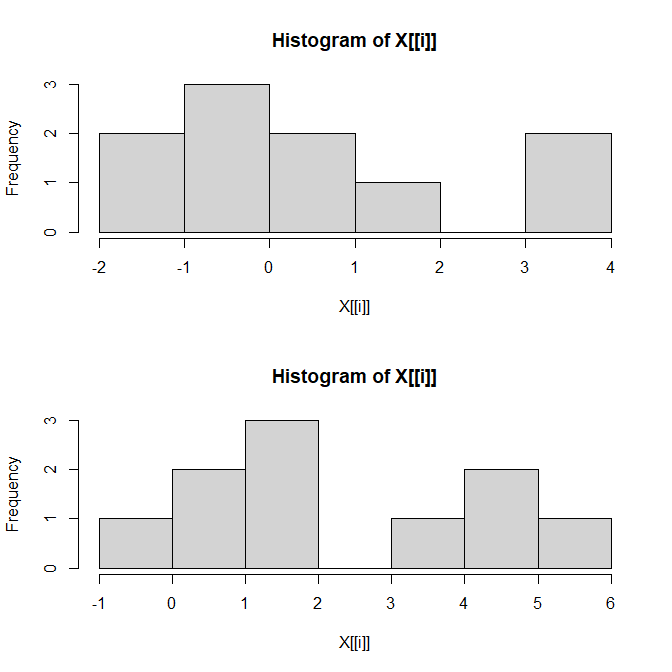
R でグラフを複数並べる方法 グラフを縦に2つ並べる layout(1:2)
グラフを縦に 2 つ並べる場合は、layout(1:2) としてから、グラフを 2 つ書く指令を出す
tapply() で 2 グループのグラフをいっぺんに書いてもよい
例えば、以下のようにスクリプトを書く
layout(1:2)
tapply(sleep$extra, sleep$group, hist)
そうすると、以下のように書かれる

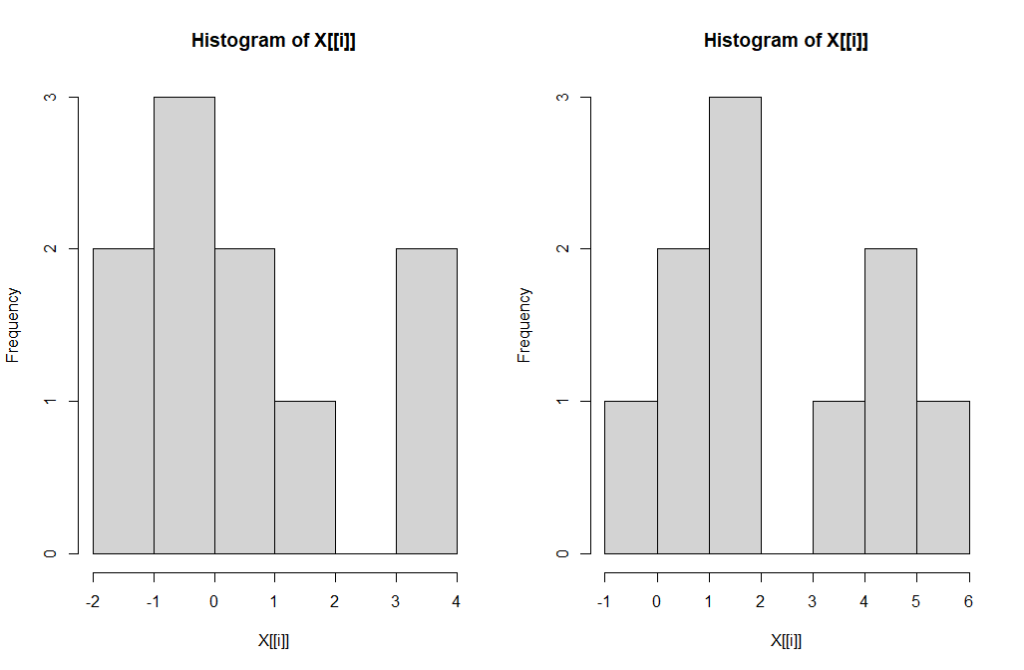
R でグラフを複数並べる方法 グラフを横に2つ並べる layout(t(1:2))
グラフを横に 2 つ並べる場合は、layout(t(1:2)) とする
layout(t(1:2))
tapply(sleep$extra, sleep$group, hist)
すると以下のように横に 2 つ並んだグラフが描ける
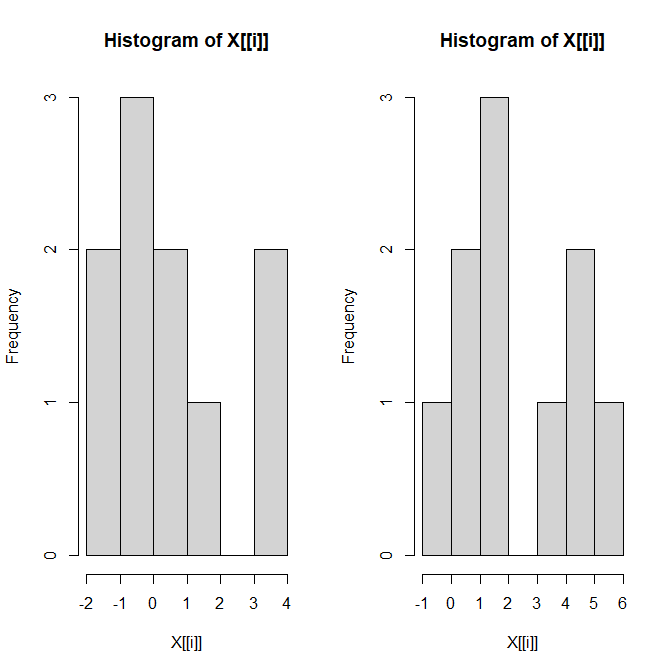
グラフ領域を横に広げる(ドラッグする)と見栄えが良くなる
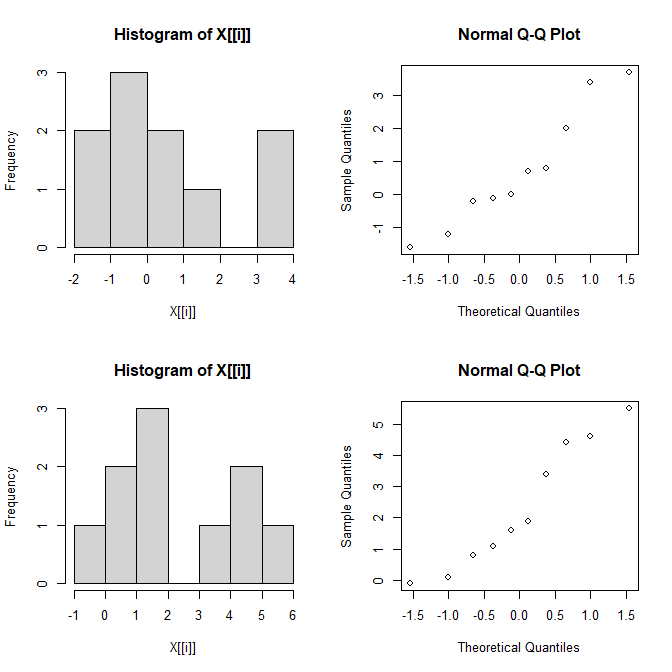
R でグラフを複数並べる方法 グラフを4つ並べる(左上、左下、右上、右下の順)
グラフを 4 つ並べたい場合は、layout(matrix(1:4, nr=2)) を使う
nr= は 行数の指定で、2 は 2 行を指定している
1 から 4 の数字を、2 行の行列にする指定なので、2 行 2 列になる
layout(matrix(1:4, nr=2))
tapply(sleep$extra, sleep$group, hist)
tapply(sleep$extra, sleep$group, qqnorm)
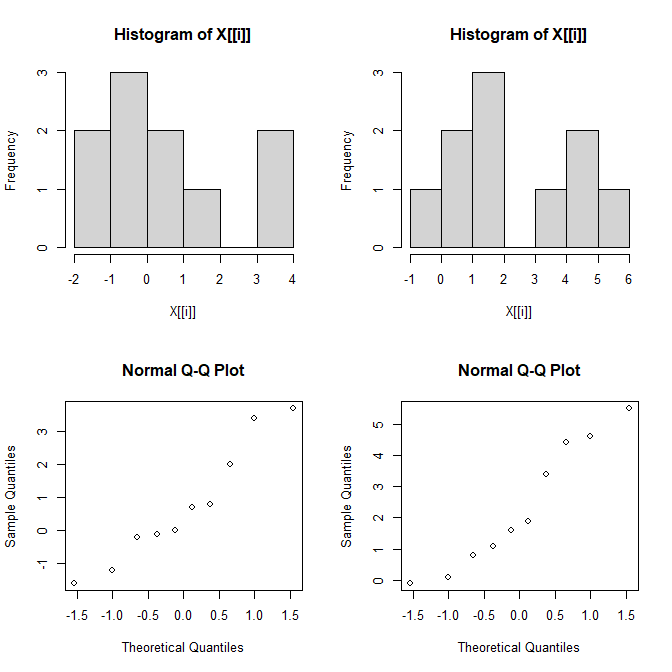
そうすると以下のように 2 行 2 列のグラフ描画領域に 4 つのグラフが描ける
R でグラフを複数並べる方法 グラフを別の方法で4つ並べる(左上、右上、左下、右下の順)
4 つのグラフを、横に目を動かして、左右、左右と並ぶようにするには、layout(t(matrix(1:4, nr=2))) とする
t() というのは転置という意味
layout(t(matrix(1:4,nr=2)))
tapply(sleep$extra, sleep$group, hist)
tapply(sleep$extra, sleep$group, qqnorm)
今度は、左右、左右と描画されて 4 つのグラフが並んだ
まとめ
R でグラフを複数並べる方法を解説した
縦に並べるなら layout(1:2)
横に並べるなら layout(t(1:2))
縦方向の順番で 2×2 なら layout(matrix(1:4, nr=2))
横方向の順番で 2×2 なら layout(t(matrix(1:4, nr=2)))
参考になれば幸い


コメント