ブランド アルトマン 分析は、二つの測定系の結果が一致しているかどうかを確認する方法。
ブランド アルトマン プロットに、回帰直線を合わせると不一致に傾向がないかどうか確認できる。
ブランドアルトマン分析の準備
ブランドアルトマンプロットは、2つの測定値の平均値をX軸に、差をY軸にしてプロットする。
blandr パッケージを使うと簡単に描ける。
まず blandr パッケージをインストールする。
install.packages("blandr")
インストールが終了したら呼び出す。
これで準備完了。
library(blandr)
Bland and Altman 1986 論文からPEFR (Peak Expiratory Flow Rate)のデータを使ってグラフを描く。
bland.altman.PEFR.1986データセットの一列目(Wright Meter の測定一回目)と三列目(Mini Wright Meter の測定一回目)を使う。
dat0 <- bland.altman.PEFR.1986
dat <- blandr.data.preparation(dat0[,1],dat0[,3],sig.level=0.95)
datの内容をsummary(dat)で見てみる。
二つの測定方法はmethod1とmethod2という名前になる。
> summary(dat)
method1         method2
Min.   :178.0   Min.   :259.0
1st Qu.:417.0   1st Qu.:380.0
Median :434.0   Median :445.0
Mean   :450.4   Mean   :452.5
3rd Qu.:494.0   3rd Qu.:512.0
Max.   :656.0   Max.   :658.0
ブランドアルトマンプロットの書き方
ブランドアルトマンプロットは以下のように記述すると書ける。
with(dat, blandr.draw(method1, method2,
ciShading=TRUE,
plotTitle="Difference against mean for PEFR data"))
キモは blandr.draw(method1, method2)
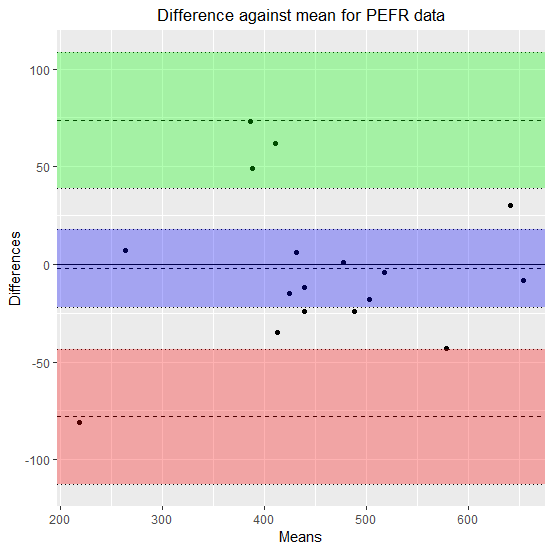
ciShading=TRUEでBiasの範囲(青)とLower limit of agreementの範囲(赤)、Upper limit of agreementの範囲(緑)が塗られる。
Limit of agreementよりも離れた点がないかどうか、離れた点が多いかどうかで、一致している具合を判断する。
その際、Limit of agreementにも幅があることも考慮に入れる。
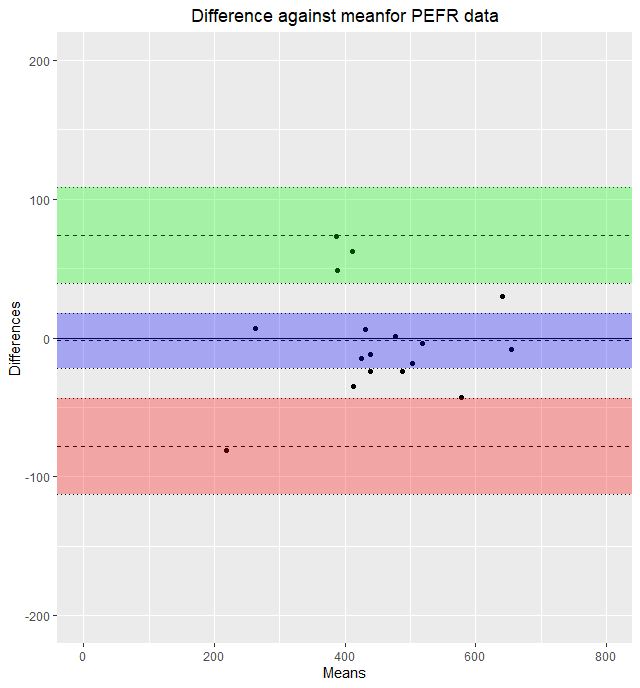
X 軸 Y 軸を変更するには以下のようにする
まず、基本的なプロットをオブジェクトにする
そこに X 軸 Y 軸の限界値を+でつなぎ合わせて指定し、描画する(coord_cartesian を使用する)
ブランドアルトマンプロット自体は、ggplot2 を用いているので、その記法にのっとる必要がある
library(ggplot2)
# 基本的なプロットをオブジェクトにする
bland.altman.plot <- with(dat, blandr.draw(method1, method2,
ciShading=TRUE,
plotTitle='Difference against meanfor PEFR data'))
# X 軸 Y 軸の限界値を+で指定して描画する
bland.altman.plot + coord_cartesian(xlim=c(0,800), ylim=c(-200, 200))
そうすると、以下のように X 軸 Y 軸の範囲を変更できる
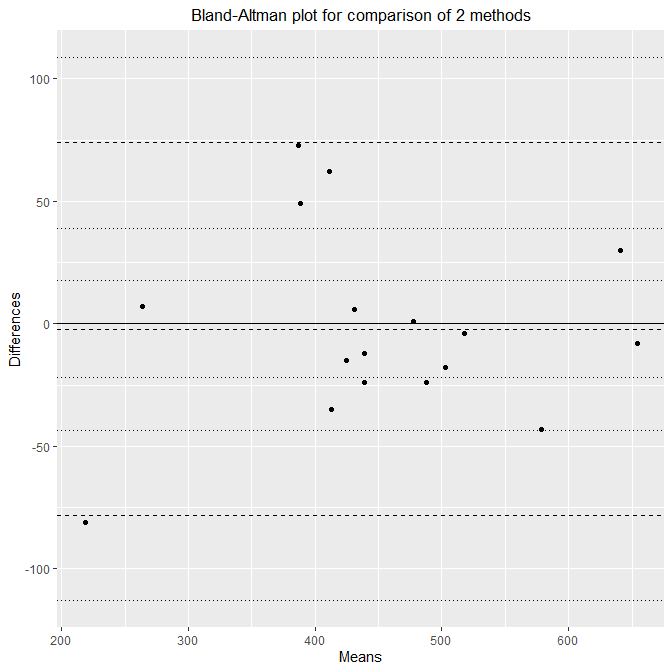
Bias の範囲や、Limit of Agreement の範囲を塗りつぶしを取り除くには、ciShading=FALSE とする。
with(dat, blandr.draw(method1, method2, ciShading=FALSE))
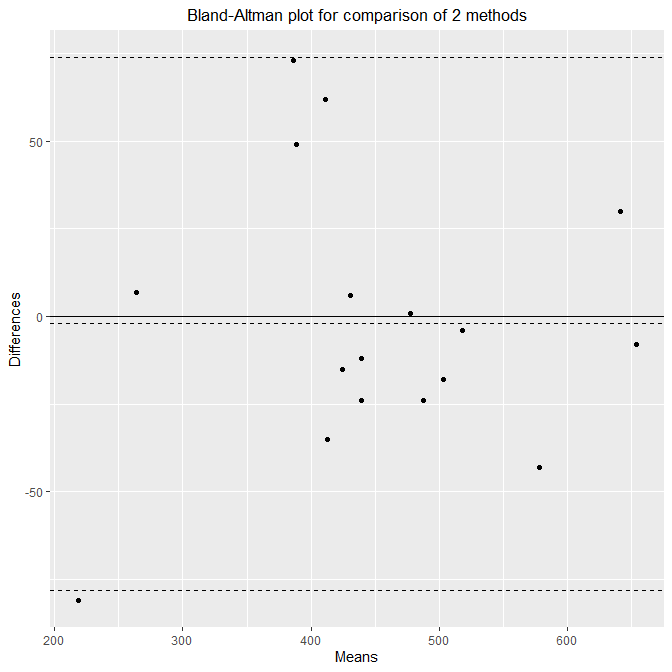
Bias の範囲の上限・下限、Limit of Agreement の上限・下限の線を取り除くには、ciDisplay=FALSE とする。
with(dat, blandr.draw(method1, method2, ciShading=FALSE, ciDisplay=FALSE))
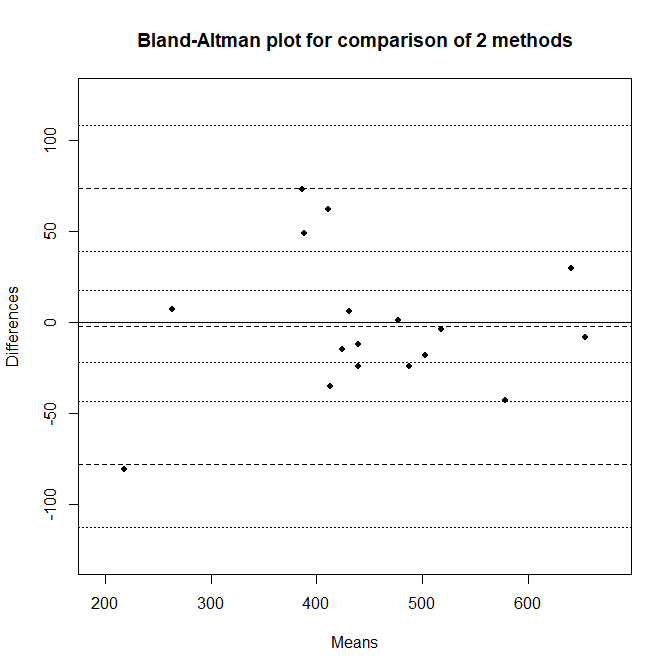
背景のグリッドを削除するには、plotter=”rplot” とする。
with(dat, blandr.draw(method1, method2, ciShading=FALSE, plotter="rplot"))
ブランドアルトマン分析の結果出力方法
blandr.display.and.draw() を使うと、グラフの描画とともに分析結果を表示してくれる。
また、blandr.output.text() はテキスト出力だけ行う。
with(dat, blandr.display.and.draw(method1, method2,
ciShading=TRUE,
plotTitle="Difference against mean for PEFR data"))
with(dat, blandr.output.text(method1, method2))
Biasが2つの測定方法の差の平均値。
その95%の分布範囲(±1.96SD)がLimits of agreement(LOA)。
上限値がUpper LOA(ULoA)、下限値がLower LOA(LLoA)。
Bias、Upper LOA、Lower LOAそれぞれの95%信頼区間が計算されている。
Number of comparisons:  17
Maximum value for average measures:  654
Minimum value for average measures:  218.5
Maximum value for difference in measures:  73
Minimum value for difference in measures:  -81
Bias:  -2.117647
Standard deviation of bias:  38.76513
Standard error of bias:  9.401925
Standard error for limits of agreement:  16.39491
Bias:  -2.117647
Bias- upper 95% CI:  17.81354
Bias- lower 95% CI:  -22.04884
Upper limit of agreement:  73.86201
Upper LOA- upper 95% CI:  108.6177
Upper LOA- lower 95% CI:  39.10636
Lower limit of agreement:  -78.0973
Lower LOA- upper 95% CI:  -43.34165
Lower LOA- lower 95% CI:  -112.8529
Derived measures:
Mean of differences/means:  -1.158314
Point estimate of bias as proportion of lowest average:  -0.9691749
Point estimate of bias as proportion of highest average -0.3237992
Spread of data between lower and upper LoAs:  151.9593
Bias as proportion of LoA spread:  -1.393562
Bias:
-2.117647  ( -22.04884  to  17.81354 )
ULoA:
73.86201  ( 39.10636  to  108.6177 )
LLoA:
-78.0973  ( -112.8529  to  -43.34165 )
blandr.statistics()で全統計値が出力される。
> (ba.stats <- with(dat, blandr.statistics(method1, method2)))
$means
[1] 503.0 412.5 518.0 431.0 488.0 578.5 388.5 411.0 654.0 439.0 424.5 641.0 263.5
[14] 477.5 218.5 386.5 439.0
$differences
[1] -18 -35  -4   6 -24 -43  49  62  -8 -12 -15  30   7   1 -81  73 -24
$method1
[1] 494 395 516 434 476 557 413 442 650 433 417 656 267 478 178 423 427
$method2
[1] 512 430 520 428 500 600 364 380 658 445 432 626 260 477 259 350 451
$sig.level
[1] 0.95
$sig.level.convert.to.z
[1] 1.959964
$bias
[1] -2.117647
$biasUpperCI
[1] 17.81354
$biasLowerCI
[1] -22.04884
$biasStdDev
[1] 38.76513
$biasSEM
[1] 9.401925
$LOA_SEM
[1] 16.39491
$upperLOA
[1] 73.86201
$upperLOA_upperCI
[1] 108.6177
$upperLOA_lowerCI
[1] 39.10636
$lowerLOA
[1] -78.0973
$lowerLOA_upperCI
[1] -43.34165
$lowerLOA_lowerCI
[1] -112.8529
$proportion
[1]  -3.5785288  -8.4848485  -0.7722008   1.3921114  -4.9180328  -7.4330164
[7]  12.6126126  15.0851582  -1.2232416  -2.7334852  -3.5335689   4.6801872
[13]   2.6565465   0.2094241 -37.0709382  18.8874515  -5.4669704
$no.of.observations
[1] 17
$regression.equation
[1] "y(differences) = 0.029 x(means) + -15"
$regression.fixed.slope
means
0.029
$regression.fixed.intercept
(Intercept)
-15
$regression.equationは、推定回帰直線で、切片(intercept: $regression.fixed.intercept)と傾き(slope: $regression.fixed.slope)が計算されている。
これを使ってmethod1とmethod2の平均と差の回帰直線を先ほどのグラフに乗せると以下のようになる。
abline(a=ba.stats$regression.fixed.intercept,b=ba.stats$regression.fixed.slope,lwd=2)
text(400,20,ba.stats$regression.equation)
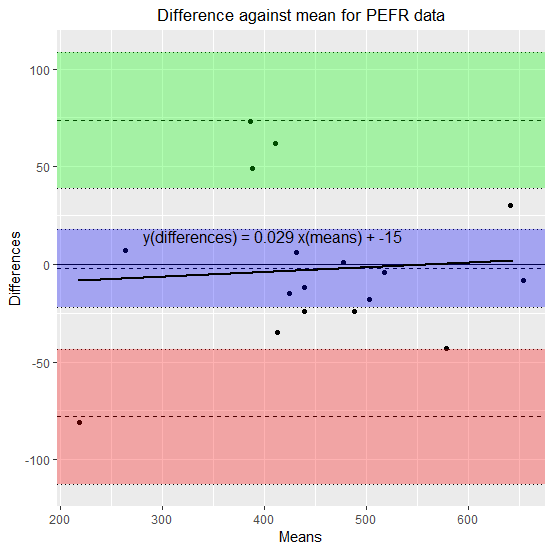
回帰分析の結果からもわかる通り、傾きは限りなくゼロに近く、平均の大小で、差の大小が決まるというような傾向はみられない。
したがって、系統誤差(一定の傾向を持ったズレ)はないと言える。
回帰分析の前に平均meanと差differenceを作成しておく。
dat$difference <- dat$method1 - dat$method2
dat$mean <- (dat$method1+dat$method2)/2
meanのEstimateは、p=0.749で傾きがゼロの帰無仮説が棄却できず、傾きゼロでないとは言えない。
> dat$difference <- dat$method1 - dat$method2
> dat$mean <- (dat$method1+dat$method2)/2
> lm1 <- lm(difference~mean,data=dat)
> summary(lm1)
Call:
lm(formula = difference ~ mean, data = dat)
Residuals:
Min      1Q  Median      3Q     Max
-72.201 -21.526  -9.526  14.508  76.980
Coefficients:
Estimate Std. Error t value Pr(>|t|)
(Intercept) -15.06750   40.97628  -0.368    0.718
mean          0.02869    0.08821   0.325    0.749
Residual standard error: 39.9 on 15 degrees of freedom
Multiple R-squared:  0.007002,  Adjusted R-squared:  -0.0592
F-statistic: 0.1058 on 1 and 15 DF,  p-value: 0.7495
ブランドアルトマン分析を blandr パッケージを使わずstep by stepでやってみる
以下を計算する:
- 差の平均値 bias
- 差の標準偏差 sd.diff
- 差の標準誤差 se.diff
- Limits of agreementの標準誤差 se.LOA
- biasの95%信頼区間 bias.ci
- biasのlimits of agreement bias.LOA
- Upper LOAの95%信頼区間 Upper LOA.ci
- Lower LOAの95%信頼区間 Lower LOA.ci
(bias <- mean(dat$difference))
(sd.diff <- sd(dat$difference))
(n <- nrow(dat))
(se.diff <- sd.diff/sqrt(n))
(se.LOA <- sqrt((1/n+qnorm(0.05/2,lower.tail=F)^2/(2*(n-1)))*sd.diff^2))
(bias <- mean(dat$difference))
(bias.ci <- bias + c(-1,1)*qt(0.05/2,lower.tail=F,df=n-1)*se.diff)
(bias.LOA <- bias + c(-1,1)*1.96*sd.diff)
(UpperLOA.ci <- bias.LOA[2] + c(-1,1)*qt(0.05/2,lower.tail=F,df=n-1)*se.LOA)
(LowerLOA.ci <- bias.LOA[1] + c(-1,1)*qt(0.05/2,lower.tail=F,df=n-1)*se.LOA)
上記のwith(dat, blandr.output.text(method1, method2))の結果と一致していることが確認できる。
> (bias <- mean(dat$difference))
[1] -2.117647
> (sd.diff <- sd(dat$difference))
[1] 38.76513
>
> (n <- nrow(dat))
[1] 17
> (se.diff <- sd.diff/sqrt(n))
[1] 9.401925
> (se.LOA <- sqrt((1/n+qnorm(0.05/2,lower.tail=F)^2/(2*(n-1)))*sd.diff^2))
[1] 16.39491
>
> (bias <- mean(dat$difference))
[1] -2.117647
> (bias.ci <- bias + c(-1,1)*qt(0.05/2,lower.tail=F,df=n-1)*se.diff)
[1] -22.04884  17.81354
>
> (bias.LOA <- bias + c(-1,1)*1.96*sd.diff)
[1] -78.09730  73.86201
> (UpperLOA.ci <- bias.LOA[2] + c(-1,1)*qt(0.05/2,lower.tail=F,df=n-1)*se.LOA)
[1]  39.10636 108.61766
> (LowerLOA.ci <- bias.LOA[1] + c(-1,1)*qt(0.05/2,lower.tail=F,df=n-1)*se.LOA)
[1] -112.85295  -43.34165
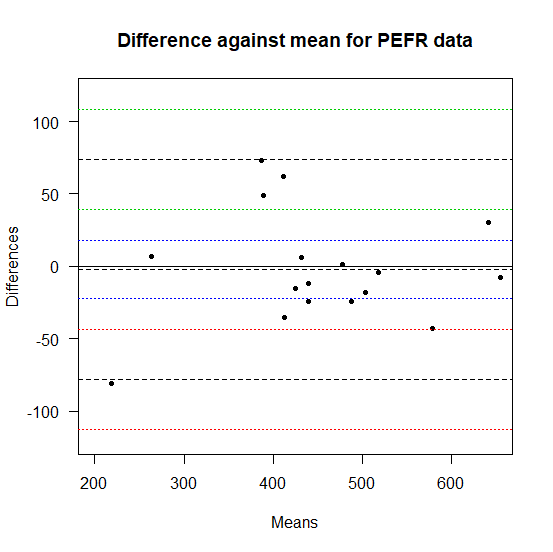
ブランドアルトマンプロットを以下のスクリプトで描くと、blandr.draw()に近いプロットが描ける。
95%信頼区間の範囲を塗りつぶす代わりに、95%信頼区間の上限下限を色付きの点線で描いた。
plot(difference~mean, data=dat, ylim=c(-120,120), xlim=c(200,650),las=1,
ylab="Differences",xlab="Means",main="Difference against mean for PEFR data",pch=20)
abline(h=0)
abline(h=c(bias,bias.ci),lty=c(2,3,3),col=c(1,4,4))
abline(h=c(bias.LOA[2],UpperLOA.ci),lty=c(2,3,3),col=c(1,3,3))
abline(h=c(bias.LOA[1],LowerLOA.ci),lty=c(2,3,3),col=c(1,2,2))
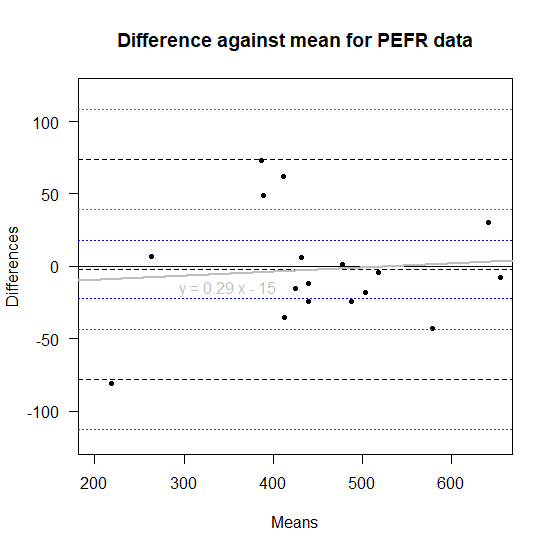
さらに回帰直線を重ねると以下のようになる。
回帰直線はグレーで描きいれた。
lm1 <- lm(difference~mean,data=dat)
abline(a=lm1$coeff[1],b=lm1$coeff[2],col="gray",lwd=2)
text(350,-15,"y = 0.29 x - 15",col="gray")
まとめ
二つの測定方法の一致を確認する分析方法のBland-Altman Plotを統計ソフトRで描いてみた。
blandrパッケージはggplot2を使ったきれいなグラフが描ける。
また、パッケージを使わずにstep by stepで確認してみたらと理解が深まった。
参考サイト・PDF
ブランドアルトマンプロットを発明したJ. Martin Bland教授のウェブサイト
https://www-users.york.ac.uk/~mb55/meas//ba.htm#top
blandr パッケージのマニュアル



コメント