競合リスク回帰とは、共変量調整をした競合リスク分析の方法。
競合リスク回帰の前に競合リスクとは?
競合リスクについては、以下を参照。
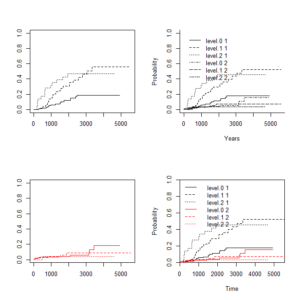
競合リスク回帰の種類
競合リスク回帰モデルには四つ考えられる。
- 絶対リスク回帰 Absolute Risk Regression
- ロジスティックリスク回帰 Logistic Risk Regression
- Fine-Gray 回帰 Fine and Gray Regression =狭義の(いわゆる)競合リスク回帰 Competing Risk Regression
- 原因別 Cox 回帰 Cause-Specific Cox Regression
おすすめは1番の絶対リスク回帰。
割合の回帰分析なので、結果の意味あいがわかりやすい。
Link functionはログ
$$ \log p $$
2番目のロジスティックリスク回帰は、オッズ比の回帰分析。
Link functionはロジット
$$ \log \frac{p}{1 – p} $$
一番世間に知られているのは3番のいわゆる競合リスク回帰の Fine-Gray 回帰だが、回帰係数の解釈が難しいのが欠点。
Link functionは complementary log-log
$$ \log{(- \log{p})} $$
4番目の原因別 Cox 回帰は、エンドポイントごとに Cox 回帰を行うもので、やっていることはわかりやすいが、競合リスクを同時に扱いたいという希望をかなえてはいない。
参考文献はこちら。
https://www.ncbi.nlm.nih.gov/pmc/articles/PMC4547456
競合リスク回帰分析の準備
Rで競合リスク回帰分析を行うにはいくつかのパッケージをインストールする必要がある。
以下のスクリプトを作動させるには以下のパッケージをあらかじめインストールしておく。
- riskRegression ( ARR, LRR, CSC )
- cmprsk ( crr )
- prodlim ( Hist )
- timereg ( comp.risk )
( ) 内は、以下で登場する、各パッケージに含まれる関数名。
また、Melanoma というデータセットは、riskRegression パッケージに含まれるサンプルデータセット。
インストール方法は以下のとおり
install.packages("riskRegression")
と R コンソールに書いてエンターし、Japan の Mirror Server を選んで OK をクリック。
インストールが済んだら、library()で呼び出しておく。デフォルトでインストールされているsurvivalも呼び出しておく。
library(riskRegression)
library(cmprsk)
library(prodlim)
library(timereg)
library(survival)
競合リスク回帰 1: 絶対リスク回帰
浸潤のリスクを推定するため、年齢を共変量としてモデルを作成し解析する。
ARR()の中にEvent History変数を作るHist()を使う。
status==1(メラノーマによる死亡。検討したいエンドポイント)のリスクを計算してもらうためにcause=1をつける。
ARR1 <- ARR(Hist(time,status)~invasion+age,
data=Melanoma,cause=1)
summary(ARR1)
riskRegression()を使う場合link=”relative”とする。
結果は同じになる。
rR1 <- riskRegression(Hist(time,status)~invasion+age,
data=Melanoma,cause=1,link="relative")
summary(rR1)
> summary(ARR1)
riskRegression: Competing risks regression model
IPCW estimation. The weights are based on
the Kaplan-Meier estimate for the censoring distribution.
Link function: 'relative' yielding absolute risk ratios, see help(riskRegression).
(中略)
Time constant regression coefficients:
Factor    Coef exp(Coef) StandardError       z         CI_95    Pvalue
invasionlevel.1   0.833     2.301         0.319   2.612 [1.231;4.300] 0.0089994
invasionlevel.2   1.313     3.717         0.338   3.880 [1.915;7.213] 0.0001044
age 0.00440   1.00441       0.00795 0.55335 [0.989;1.020] 0.5800251
Note: The values exp(Coef) are absolute risk ratios
結果は上記の通りで、浸潤レベルゼロに比べ1は2.3倍のメラノーマ死亡のリスク、2は3.7倍のリスクと言える。
競合リスク回帰 2: ロジスティックリスク回帰
ロジスティックリスク回帰はLRR()を使う。
LRR1 <- LRR(Hist(time,status)~invasion+age,
data=Melanoma,cause=1)
summary(LRR1)
riskRegression()を使う場合はlink=”logistic”とする。上記と同じ結果になる。
rR.L1 <- riskRegression(Hist(time,status)~invasion+age,
data=Melanoma,cause=1,link="logistic")
summary(rR.L1)
> summary(LRR1)
riskRegression: Competing risks regression model
IPCW estimation. The weights are based on
the Kaplan-Meier estimate for the censoring distribution.
Link function: 'logistic' yielding odds ratios, see help(riskRegression).
(中略)
Time constant regression coefficients:
Factor    Coef exp(Coef) StandardError       z          CI_95    Pvalue
invasionlevel.1   1.058     2.881         0.392   2.701 [1.337; 6.210] 0.0069102
invasionlevel.2   1.818     6.160         0.477   3.808 [2.416;15.701] 0.0001401
age 0.00384   1.00385       0.01165 0.32964 [0.981; 1.027] 0.7416742
Note: The values exp(Coef) are odds ratios
ロジスティックリスク回帰の結果としてのオッズ比は、絶対リスク回帰の結果に比べると大きくなり、浸潤レベル1はゼロに比べオッズ比2.9、2はオッズ比6.2となる。
競合リスク回帰 3: Fine-Gray 回帰
Fine-Gray回帰はcomp.risk()を使う。Time to Eventデータに変換するEvent()を使う。
cr1 <- comp.risk(Event(time,status)~const(invasion)+const(age),
data=Melanoma,cause=1,model="prop")
summary(cr1)
riskRegression()でもlink=”prop”とすると同じ計算ができる。
rR.FG1 <- riskRegression(Hist(time,status)~invasion+age,
data=Melanoma,cause=1,link="prop")
summary(rR.FG1)
> summary(cr1)
Competing risks Model
No test for non-parametric terms
Parametric terms :
Coef.      SE Robust SE     z    P-val lower2.5%
const(invasion)level.1 0.93900 0.35300   0.35300 2.660 0.007740    0.2470
const(invasion)level.2 1.55000 0.40100   0.40100 3.870 0.000108    0.7640
const(age)             0.00414 0.00984   0.00984 0.421 0.674000   -0.0151
upper97.5%
const(invasion)level.1     1.6300
const(invasion)level.2     2.3400
const(age)                 0.0234
> summary(rR.FG1)
riskRegression: Competing risks regression model
IPCW estimation. The weights are based on
the Kaplan-Meier estimate for the censoring distribution.
Link function: 'proportional' yielding sub-hazard ratios (Fine & Gray 1999), see help(riskRegression).
(中略)
Time constant regression coefficients:
Factor    Coef exp(Coef) StandardError       z          CI_95   Pvalue
invasionlevel.1   0.939     2.558         0.353   2.663 [1.282; 5.106] 0.007736
invasionlevel.2   1.551     4.716         0.401   3.872 [2.151;10.339] 0.000108
age 0.00414   1.00415       0.00984 0.42116 [0.985; 1.024] 0.673635
Note: The values exp(Coef) are sub-hazard ratios (Fine & Gray 1999)
結果は、浸潤レベルゼロに比べ1の場合は2.6倍のリスク、2の場合は4.7倍のリスクとなる。
解説動画:EZRで Fine-Gray 回帰
競合リスク回帰 4: 原因別 Cox 回帰
原因別 Cox 回帰は CSC() を使う。
CSC1 <- CSC(Hist(time,status)~invasion+age,
data=Melanoma)
summary(CSC1)
いままでと違うところは、競合リスクのハザード比も同時に計算してくれるところ。
イベント cause=1(メラノーマによる死亡)のリスクは浸潤レベルゼロに比べ1は2.8倍、2は3.9倍だった。
これは、絶対リスク回帰に近い。
競合リスク(cause=2, メラノーマ以外による死亡)は、年齢が統計学的有意なリスクで、1歳年を取るごとに1.1倍のリスクであった。
年を取れば人は亡くなる。
当然と言えば当然。
メラノーマの浸潤レベルは無関係だ。
> print(CSC1)
CSC(formula = Hist(time, status) ~ invasion + age, data = Melanoma)
Right-censored response of a competing.risks model
No.Observations: 205
Pattern:
Cause     event right.censored
1          57              0
2          14              0
unknown     0            134
----------> Cause:  1
Call:
survival::coxph(formula = survival::Surv(time, status) ~ invasion +
age, x = TRUE, y = TRUE)
n= 205, number of events= 57
coef exp(coef) se(coef)     z Pr(>|z|)
invasionlevel.1 1.016821  2.764392 0.328422 3.096 0.001961 **
invasionlevel.2 1.351844  3.864544 0.381768 3.541 0.000399 ***
age             0.011377  1.011442 0.008577 1.327 0.184669
---
Signif. codes:  0 ‘***’ 0.001 ‘**’ 0.01 ‘*’ 0.05 ‘.’ 0.1 ‘ ’ 1
exp(coef) exp(-coef) lower .95 upper .95
invasionlevel.1     2.764     0.3617    1.4523     5.262
invasionlevel.2     3.865     0.2588    1.8287     8.167
age                 1.011     0.9887    0.9946     1.029
Concordance= 0.674  (se = 0.034 )
Likelihood ratio test= 20.58  on 3 df,   p=1e-04
Wald test            = 18.51  on 3 df,   p=3e-04
Score (logrank) test = 20.72  on 3 df,   p=1e-04
----------> Cause:  2
Call:
survival::coxph(formula = survival::Surv(time, status) ~ invasion +
age, x = TRUE, y = TRUE)
n= 205, number of events= 14
coef exp(coef) se(coef)      z Pr(>|z|)
invasionlevel.1 -0.90629   0.40402  0.63869 -1.419  0.15590
invasionlevel.2 -1.36947   0.25424  1.11620 -1.227  0.21986
age              0.09509   1.09975  0.02574  3.694  0.00022 ***
---
Signif. codes:  0 ‘***’ 0.001 ‘**’ 0.01 ‘*’ 0.05 ‘.’ 0.1 ‘ ’ 1
exp(coef) exp(-coef) lower .95 upper .95
invasionlevel.1    0.4040     2.4751   0.11555     1.413
invasionlevel.2    0.2542     3.9333   0.02852     2.267
age                1.0998     0.9093   1.04565     1.157
Concordance= 0.827  (se = 0.043 )
Likelihood ratio test= 18.66  on 3 df,   p=3e-04
Wald test            = 13.76  on 3 df,   p=0.003
Score (logrank) test = 14.67  on 3 df,   p=0.002
イベント無発生生存割合 Event-free survival も解析できる。
type=”surv”と追加する。
CSC.EFS1 <- CSC(Hist(time,status)~invasion+age,
data=Melanoma,surv.type="surv")
print(CSC.EFS1)
前半はcause=1の結果だが、後半は Event-Free Survival の結果である。
正確には「イベントと競合リスクを合わせたもの」である。
浸潤レベルも年齢も適度に関連している。
----------> Event-free survival:
Call:
survival::coxph(formula = survival::Surv(time, status) ~ invasion +
age, x = TRUE, y = TRUE)
n= 205, number of events= 71
coef exp(coef) se(coef)     z Pr(>|z|)
invasionlevel.1 0.646208  1.908291 0.281969 2.292  0.02192 *
invasionlevel.2 0.912198  2.489789 0.342881 2.660  0.00781 **
age             0.023160  1.023430 0.008164 2.837  0.00456 **
---
Signif. codes:  0 ‘***’ 0.001 ‘**’ 0.01 ‘*’ 0.05 ‘.’ 0.1 ‘ ’ 1
exp(coef) exp(-coef) lower .95 upper .95
invasionlevel.1     1.908     0.5240     1.098     3.316
invasionlevel.2     2.490     0.4016     1.271     4.876
age                 1.023     0.9771     1.007     1.040
Concordance= 0.66  (se = 0.032 )
Likelihood ratio test= 22.29  on 3 df,   p=6e-05
Wald test            = 21.22  on 3 df,   p=9e-05
Score (logrank) test = 22.35  on 3 df,   p=6e-05
原因別 Cox 回帰を通常の Cox 回帰で再現してみる
ちなみに原因別 Cox 回帰を通常の Cox 回帰 coxph() で再現してみるとどうなるか?
coxph1 <- coxph(Surv(time,status==1)~invasion+age,
data=Melanoma)
summary(coxph1)
coxph2 <- coxph(Surv(time,status==2)~invasion+age,
data=Melanoma)
summary(coxph2)
coxph3 <- coxph(Surv(time,status!=0)~invasion+age,
data=Melanoma)
summary(coxph3)
coxph1がcause=1の結果、coxph2がcause=2の結果、coxph3がcauseの1と2を合わせた Event-Free Survival の結果とそれぞれ一致する。
> summary(coxph1)
Call:
coxph(formula = Surv(time, status == 1) ~ invasion + age, data = Melanoma)
n= 205, number of events= 57
coef exp(coef) se(coef)     z Pr(>|z|)
invasionlevel.1 1.016821  2.764392 0.328422 3.096 0.001961 **
invasionlevel.2 1.351844  3.864544 0.381768 3.541 0.000399 ***
age             0.011377  1.011442 0.008577 1.327 0.184669
---
Signif. codes:  0 ‘***’ 0.001 ‘**’ 0.01 ‘*’ 0.05 ‘.’ 0.1 ‘ ’ 1
(後略)
> summary(coxph2)
Call:
coxph(formula = Surv(time, status == 2) ~ invasion + age, data = Melanoma)
n= 205, number of events= 14
coef exp(coef) se(coef)      z Pr(>|z|)
invasionlevel.1 -0.90629   0.40402  0.63869 -1.419  0.15590
invasionlevel.2 -1.36947   0.25424  1.11620 -1.227  0.21986
age              0.09509   1.09975  0.02574  3.694  0.00022 ***
---
Signif. codes:  0 ‘***’ 0.001 ‘**’ 0.01 ‘*’ 0.05 ‘.’ 0.1 ‘ ’ 1
(後略)
> summary(coxph3)
Call:
coxph(formula = Surv(time, status != 0) ~ invasion + age, data = Melanoma)
n= 205, number of events= 71
coef exp(coef) se(coef)     z Pr(>|z|)
invasionlevel.1 0.646208  1.908291 0.281969 2.292  0.02192 *
invasionlevel.2 0.912198  2.489789 0.342881 2.660  0.00781 **
age             0.023160  1.023430 0.008164 2.837  0.00456 **
---
Signif. codes:  0 ‘***’ 0.001 ‘**’ 0.01 ‘*’ 0.05 ‘.’ 0.1 ‘ ’ 1
(後略)
まとめ
競合リスクがある場合の生存時間分析で、モデルを使った共変量調整を行いたい場合の方法を紹介した。
競合リスク回帰の分析方法は四つあるが、方法論の適切性と結果の解釈のわかりやすさを考慮すると絶対リスク回帰がおすすめだ。
Rであれば、riskRegression, prodlim の二つのパッケージをインストールすれば実現可能である。


コメント
コメント一覧 (1件)
[…] R で競合リスク回帰を実行する方法 競合リスク回帰とは、共変量調整をした競合リスク分析の方法。 […]